 |
 |
||||||||||
| MPE | ||||||
X-RAY ABSORPTION IN ATOMIC Cd IN THE K EDGE REGION
Related publications: A. Kodre, J. Padežnik Gomilšek, A. Mihelič, I. Arčon; X-ray absorption in atomic Cd in the K edge region, Radiation Physics and Chemistry 75, (2006), 188-194
Abstract
The x-ray absorption in the K edge region is measured on Cd vapor in a sealed high-temperature cell. The absorption spectrum, free of structural signal, represents atomic absorption of the element, with fingerprints of multielectron excitations visible after natural-width deconvolution. Absolute values of the atomic photoabsorption coefficient are obtained from renormalization with Cd foil data far from the edge. Possible sources of systematic error in synchrotron radiation measurement of absolute absorption are discussed.
Keywords: cadmium vapor, x-ray absorption coefficient, Cd K edge, multielectron photoexcitations, atomic absorption background
Introduction
Experimental determination of the x-ray absorption coefficient is of interest in two separate, weakly overlapping fields of research. Absolute values of the elemental photoabsorption cross-section over broad spectral regions are required to build the absorption coefficient of materials for the purpose of dosimetry, radiological physics, absorption corrections in x-ray fluorescence, diffraction and crystallography in general, plasma diagnostics and astrophysics. Low-resolution and moderate-precision data are sufficient since the information is often used in the compressed form of Victoreen-formula parameters and edge jumps, disregarding the fine detail of non-monotonic intra-atomic and structural contributions in the vicinity of absorption edges. These are the subject of the second research field, the x-ray absorption spectrometry where high-resolution, high precision data are required but the absolute measurement is seldom of interest since the normalization to the adjacent edge jump is implied by theoretical considerations. From the quasiperiodic oscillations of the absorption coefficient above major absorption edges (XAFS = X-ray Absorption Fine Structure) the atomic vicinity of the target atom can be recovered (Koningsberger and Prins, 1988). Small sharp spectral features such as resonant peaks and absorption edges are fingerprints of multielectron photoexcitations (MPE): they provide experimental material in the study of the inner dynamics of the atom (Kodre et al., 2002).
The routine x-ray absorption spectrometry on dedicated synchrotron lines is specifically adapted to the second field of interest. In spite of its high precision and reproducibility the experimental setup is not optimized for the broad-range absolute measurement of the absorption coefficient. A discussion of the main problematic points is given in our previous report on the x-ray atomic absorption in Rb (Prešeren and Kodre, 1999).
In an earlier series of experiments the absorption in the region of K edge has been measured on some metal vapors: potassium (Prešeren et al.,1999), rubidium (Prešeren et al.,1996), cesium (Padežnik Gomilšek et al., 2003), mercury (Filipponi et al., 1993), zinc (Mihelič et al., 2002). In these experiments, devoted to the study of MPE, the pure atomic absorption, free of the structural XAFS signal, had been determined. The energy range of the data typically extended from ~300 eV below the edge to 1 keV above it. Narrow range measurements of K-edge profiles of some 3d transition metal vapors are reported by Arp et al. (1993).
In the conversion of the data to absolute absorption coefficient the major obstacle is the poor definition of the mass of the investigated element sealed in the high-temperature absorption cell. In the cells with dynamical vapor regime (potassium heat-pipe cell and zinc double cell) the amount of the vaporized element in the beam path remains unknown. The soft and extremely reactive rubidium and cesium are awkward to handle without a protective paraffin oil layer and they tend to stick to the walls of the duct in filling the cell. The absolute absorption of Rb (Prešeren and Kodre, 1999) could only be determined by a renormalization of the vapor data with the absorption coefficient of a solution of a rubidium salt measured at a few energy points within the range.
Cadmium, like its homologue zinc, is one of the few volatile metals and hence a candidate to continue the above series of experiments. In contrast to the corrosive Zn vapor which could only be contained in a double corundum cell, Cd vapor was found considerably less aggressive and plain sealed cells of the standard vacuum materials could be used to contain the vapor at a stable density. Unlike the alkaline metals, cadmium was stable enough so that the quantity to provide optimum absorption could be weighed with moderate accuracy and reliably introduced into the cell; in addition, a parallel measurement on a well-defined metal foil could provide the energy calibration of the monochromator and a check on the vapor absorption further out from the edge. However, the precision of the cell charge weighing was too low to produce state-of-the-art absorption data with 2% accuracy: this goal was achieved only by renormalization of the atomic Cd absorption with a set of dedicated measurements on the foil.
The volatility of Cd has already been exploited in absorption spectrometry (Codling et al., 1978) but in the extremely soft x-ray region (<250 eV). A heat-pipe cell has been used, with an ingenious method of determining the absolute absorption from the comparison with absorption in the inert gas in the cell. In view of the estimated accuracy of 20%, excellent for the soft x-ray region, the transfer of the technique to the K-edge region is not warranted.
Experiment
Cadmium vapor was contained in a quartz cell with 1 mm thick quartz windows. A charge of 18 mg of Cd was completely vaporized by 900oC with the resulting K edge jump of 1.8. The surface density of Cd vapor was estimated at (37 ![]() 2) mg/cm
2) mg/cm![]() .
.
The experiment was performed at the BM 29 beamline of ESRF (Grenoble), using a Si 311 double-crystal monochromator with 2 eV resolution in the region of Cd K edge (26.7 keV). By detuning the monochromator crystals to the 40% of the rocking curve maximum, using the beam-stabilization feedback control, the almost negligible intensity of the 3rd harmonic (at ~75 keV) is further reduced by at least a factor of 10![]() .
.
The intensity of the x-ray beam is measured by three consecutive ionization chambers filled with Kr/He gas mixture (7%, 24% and 24% of Kr, respectively) at a stable 2 bar pressure. The absorption cell is inserted between the first pair of chambers, and a Cd foil for energy calibration between the last pair. The absorbance ![]() d of an absorber is determined as the logarithm of the ratio of ionization currents in the front and back detector.
d of an absorber is determined as the logarithm of the ratio of ionization currents in the front and back detector.
The absorption spectra of three identical runs were routinely superposed to improve the signal to noise ratio while their reproducibility (within 0.2%) served as a check on the stability of the detection system. The spectra taken on the cell during the slow heating, before the Cd charge started to evaporate, were used as the reference absorption, accounting for the attenuation of the beam in the cell windows and for the differential sensitivity of the ionization chambers. The net Cd vapor absorption was determined as a difference of absorbance measured on the heated and the cold cell. The simultaneous measurement of the absorption of a Cd metal foil provided a precise calibration of the common energy scale.
In the renormalization measurement of the absorption coefficient a 25 micron foil (Goodfellow CD000160/3, 99.7% Cd) was used. The average surface density of the foil, (21.8 ![]() 0.3) mg/cm
0.3) mg/cm![]() was determined by weighing (Sartorius MC 210S) and by measuring the surface area on an enlarged computer scan of the specimen. The experiment was performed at the X1 beamline of the DORIS ring at HASYLAB, DESY, Hamburg. A Si 311 double-crystal monochromator with resolution of about 3 eV was equipped with a similar harmonics-rejection system as at BM29. The ionization chambers were kept at ambient pressure: the first one was filled with a gas mixture of 10% Kr and 90% Ar, and the second one with pure krypton.
was determined by weighing (Sartorius MC 210S) and by measuring the surface area on an enlarged computer scan of the specimen. The experiment was performed at the X1 beamline of the DORIS ring at HASYLAB, DESY, Hamburg. A Si 311 double-crystal monochromator with resolution of about 3 eV was equipped with a similar harmonics-rejection system as at BM29. The ionization chambers were kept at ambient pressure: the first one was filled with a gas mixture of 10% Kr and 90% Ar, and the second one with pure krypton.
An interval of 2.7 keV was covered in wide steps except for the densely scanned edge profile to provide a check on the stability of the energy scale. In several repeated scans, the influence of various experimental parameters was checked: most notably, scans with 2 and 3 layers of the foil were made to test for deviations from the exponential extinction, whereby harmonic contamination and some other sources of systematic error could be detected. In another check of the harmonic contamination, the working point of the beam-stabilization and harmonic-rejection feedback loop, routinely kept at 60% of the rocking curve height, was moved for ![]() 10%, with no apparent effect on the absorbance except for a slight shift of the energy scale, as expected.
10%, with no apparent effect on the absorbance except for a slight shift of the energy scale, as expected.
The fluorescence of the sample, if not taken into account, represents a major source of systematic error in absolute absorption spectrometry. In our experiment, changes in ionization current as much as 5% were observed when the absorber foil was shifted close to one of the ionization chambers. In the normal position of the absorber at the midpoint between the detectors the fluorescence error was kept below 0.2%.
Analysis
Energy calibration
The K edge profiles of Cd vapor and metal foil are shown in Fig. 1. The absolute energy scale is established by aligning the foil edge profile with the profile from the high precision measurement by Kraft (Kraft et al., 1996) defining a value (26713.29 ![]() 0.20) eV for the Cd metal K edge inflection point.
0.20) eV for the Cd metal K edge inflection point.
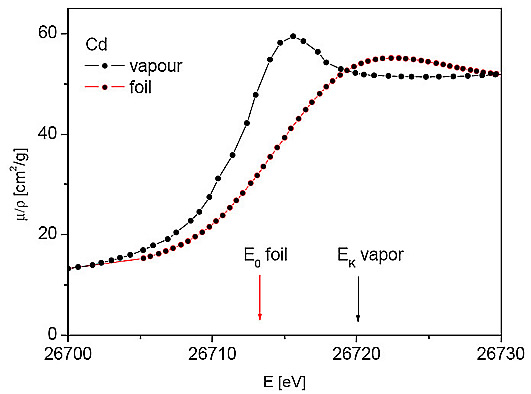
Figure 1: K edge profiles of Cd vapor and metal foil. The first inflection point in the foil spectrum (E0 foil) is ~7.0 eV below the atomic ionization energy (EK vapor).
The edge profile of the vapor starts with a Rydberg series of resonances, ending in the continuum threshold 5.2 eV above the leading resonance, according to a Dirac-Fock calculation (Dyall et al., 1989). A corresponding model of the profile comprising the leading lorentzian resonance and an apparent arctangent edge, shifted downward from the proper continuum threshold by the unresolved higher Rydberg resonances (Teodorescu et al., 1993) gives the lorentzian energy at 26715.1 eV and hence the continuum threshold at
(26720.3 ![]() 1) eV. This is in a good agreement with the accepted best theoretical value (26720.58
1) eV. This is in a good agreement with the accepted best theoretical value (26720.58 ![]() 0.41) eV, which includes nuclear-size effects and higher-order corrections (Indelicato et al., 1998; Deslattes et al., 2003).
0.41) eV, which includes nuclear-size effects and higher-order corrections (Indelicato et al., 1998; Deslattes et al., 2003).
The fit of the model also yields the lorentzian width (7.3 ![]() 0.1) eV, in perfect agreement with tabulated data (Krause and Oliver, 1979), convoluted with the 0.7 eV of the gaussian width. This gives a reasonable estimate of 1.7 eV FWHM experimental resolution. The gaussian bandwidth profile has been recently confirmed for a similar monochromator device (de Jonge et al., 2004).
0.1) eV, in perfect agreement with tabulated data (Krause and Oliver, 1979), convoluted with the 0.7 eV of the gaussian width. This gives a reasonable estimate of 1.7 eV FWHM experimental resolution. The gaussian bandwidth profile has been recently confirmed for a similar monochromator device (de Jonge et al., 2004).
Atomic absorption background
Cd vapor absorption, free of the structural XAFS signal, represents the pure atomic absorption measured for the purpose of atomic inner-shell studies. By convention, the K shell contribution is extracted and normalized to a unit edge jump (Fig. 2): the ambiguity in the definition of the exact value of the jump, introduced by the rich near-edge structure, is resolved in favor of concordance with the wide-step tabulated absorption data (cf. discussion in Padežnik Gomilšek et al., 2003). For that purpose the Victoreen exponents are determined on both sides of the edge beyond the region of XAFS and MPE, and the edge jump is calculated from these asymptotic trends extrapolated to the edge energy.
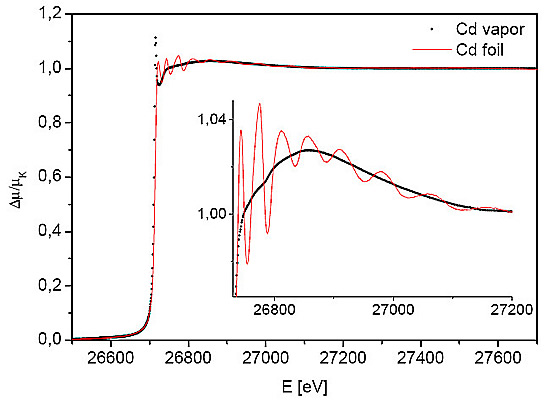
Figure 2: Normalized K-shell photoabsorption of Cd vapor and Cd foil.
The normalized atomic absorption can also serve as the atomic absorption background in the EXAFS analysis of cadmium compounds. The perfect match with the absorption spectrum of the cadmium metal foil measured in parallel with the vapor shows the excellent stability of the experiment. It is worth noting (inset) that the atomic background runs exactly along the middle of the EXAFS oscillations: with a properly measured atomic background there is no need for an artificial spline background currently used in EXAFS analysis packages (Stern et al., 1995). Moreover, the measured atomic background incorporates all the collective intraatomic effects, both the smooth extended fingerprints of the virtual excitations and the sharp features of the multielectron excitations (Kodre et al., 1997).
Apart from the steep rise ~20 eV above the K edge none of the sharp multielectron features are readily observable in the measured spectrum. The apparent absence of the MPE is due to the large lifetime width of the K shell hole (7.3 eV) which smoothes out the sharp features. The MPE can be recovered by the deconvolution of the natural width introduced recently by Filipponi (2000) (Fig. 3). A number of sharp features is revealed above the edge: they can be resolved into three basic profiles, according to the type of excitation process (Kodre et al., 2002). A small resonance and a small absorption edge are the fingerprints of double excitation and excitation-ionization, respectively. Double ionization is recognized by a small change of slope in the cross section. On this basis, the features can be attributed to formation of individual excited states. A stronger criterion in the identification, however, is the agreement with Dirac-Fock estimate of the excitation energy. These estimates are shown in Fig. 3 by pairs of markers, delineating the multiplet interval of each excitation. The observed features within 100 eV above the edge correspond to coexcitations of the valence and the two subvalence subshells. A triple excitation is invoked to explain the wide rise at 26790 eV: triple processes involving d-subshells have been observed before (Kodre et al., 2002; Padežnik Gomilšek et al., 2003).
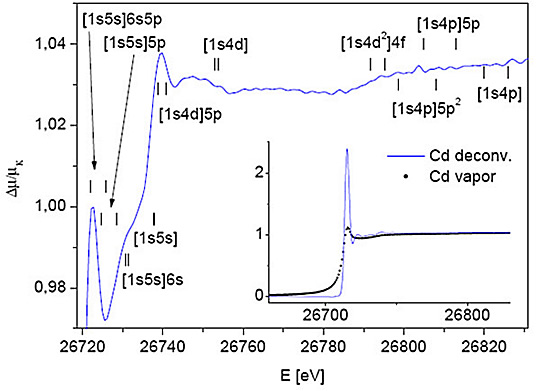
Figure 3: Deconvoluted spectrum of Cd vapor above the K-edge; DF estimates of MPE energy ranges are indicated. Comparison of the original and deconvoluted K-edge profile is shown in the inset.
The deconvolution (inset of Fig. 3) reveals the extremely strong atomic Cd pre-edge resonance [1s]5p, not observed in any other chemical species of Cd. A similar feature is observed in the homologue Zn (Mihelič et al., 2002).
Absolute absorption
The simultaneously measured absorption spectra of Cd vapor and Cd metal foil are converted to the mass-absorption values with the help of respective surface density values. The contribution of other absorbers on the beam path between the two detectors is removed by subtracting the reference absorption measurement. In the vapor spectrum, two minor effects are taken into account by numerical correction:
- the absorption in the quartz windows is not precisely cancelled out by subtraction of the reference absorption – the absorption on the hot cell is slightly lower due to thermal expansion of the quartz.
- The absorption in the air column of the oven tunnel is smaller in the hot-cell spectrum due to thermal expansion.
The absolute vapor and metal data are found to agree outside of the EXAFS region to within 10%, the discrepancy evidently arising from the uncertainty of the cell volume and Cd mass in the vapor experiment. In view of the superior accuracy of the foil data and the fact that beyond the EXAFS region the two sets of data should coincide, the vapor absorption coefficient was renormalized by the metal data at both ends of the energy interval.
Particular care was exercised to ensure the reliability of the renormalization foil data. Although the validity of the exponential decrease of the transmitted beam intensity with the absorber thickness is seldom questioned in synchrotron absorption experiments, a careful check of the relation may reveal some sources of systematic error, such as the admixture of the harmonics in the incident beam or an inhomogeneity of the absorber, including a possibility of partial obstruction of the beam on the path between the two ionization chambers. Such a check is hardly possible in the vapor experiment, but very simple in the measurement on foils. Scans with identical step progression within an expanded energy interval were taken with one, two and three layers of the foil, in addition to the scan with the empty absorption slot. The best-fit linear relation of the absorbance md vs. number of foils (0, 1, 2 and 3) was determined for each energy point in the scan. Its slope defines the local absorption coefficient, and the additive constant of the linear relation can be checked against the absorption value of the empty slot.
The analysis gives no systematic quadratic deviation from the linear relation expected from the contamination of the beam by higher harmonics. Indeed, in view of the high energy of the beam fundamental, the lowest allowed harmonics of the third order at ~75 keV is far beyond the critical point of the bending-magnet. The reflection of the second order harmonics, at ~50 keV already very low in the primary spectrum, is forbidden in ideal Si (311) crystals. We estimate the combined harmonic contamination to < 10![]() , in agreement with the upper bond for the quadratic term in the absorbance fits.
, in agreement with the upper bond for the quadratic term in the absorbance fits.
There is a systematic cubic deviation from the linear relation, similar at all energy points, with amplitude below 1%. It is attributed to a slight inhomogeneity of the foil thickness, exposed in folding of the foil. The definition of the absorption coefficient by the slope of the linear trend of the data seems to provide the properly weighted average value, in view of the fact that the surface density of the foil is determined for the entire foil.
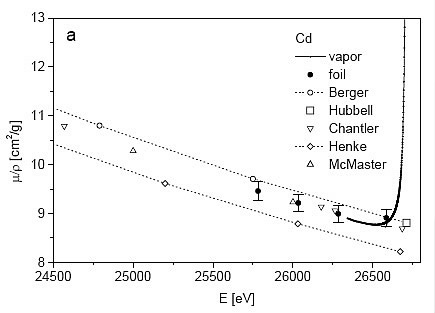
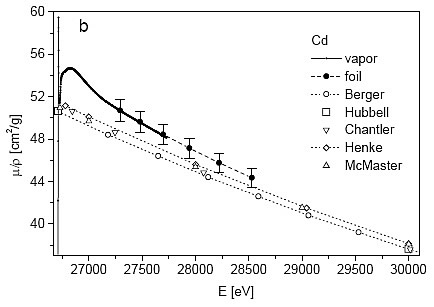
Figure 4: The measured values of metallic and (renormalized) atomic absorption coefficient of Cd in comparison with published data; a) below edge, b) above edge.
The resulting mass-absorption coefficient of atomic Cd is shown in Fig. 4: the dense data are renormalized vapor values, and the separate points at both ends the continuing foil data. For the purpose of tabulation, selected values are given in Table I. The overall estimated error of the values is close to 2%: it stems mainly from the 1.5% uncertainty in the weighing of the foil.
E [eV] |
m/r [cm |
25782 26084 26384 26585 |
9.5(2) 9.2(2) 8.9(2) 8.8(2) |
27134 27480 27943 28529 |
51.7(9) 49.6(9) 47.1(9) 44.3(8) |
Table 1: Absolute values of mass absorption coefficient of atomic Cd. The probable error in units of the last decimal place is given in parentheses.
Discussion
As evident from Fig. 4, the comparison of our results with earlier experimental data (Hubbell, 2003) is barely possible, since there is hardly an
y overlap. The data of Tajuddin et al. (1995), Prema Chand (1976) and Nageswara Rao et al. (1984) are measured at discrete energies of characteristic atomic and nuclear emission lines within a considerably wider interval. The comparison is thus limited to the tabulated theoretical values (Berger et al., 1999; Chantler et al., 2003; Hubbell and Seltzer, 2001; Henke et al., 1993; McMaster et al., 1970).
Below the edge, the agreement with Chantler and McMaster tables is very good, while values by Berger and Hubbell lie at the high end of the error interval. Above the edge, the experimental values show a systematic disagreement with tabulated data. Disregarding the small sharp features of MPE, the vapor absorption exhibits a pronounced overshoot at the edge, slowly approaching the tabulated absorption. The overshoot is explained by the core relaxation (Tulkki and Aberg, 1985) and post-collision interaction of the slow photoelectron (Amusia et al., 1981): however, their contributions to the photoelectric cross section have not been quantitatively evaluated by the theory in the form of corrections to be applied to the tabulated values in order to bring them into a better agreement with experiment. From our studies of noble-gas/alkaline-metal pairs (Kodre et al., 2002), an exponential ansatz describes the deviation sufficiently well within the present accuracy of the data. In the Cd case, the large lifetime width obscures the exponential profile of the deviation, since the slow saturation of the arctan profile of the edge largely compensates the additional exponential decrease. The interplay of the two opposing trends can be seen in the broad hump in the 200 eV region above the edge of the atomic absorption background (Fig. 2 and its inset).
Asymptotically, the measured absorption coefficient decreases towards the values given by the Henke and McMaster compilations to within one error interval. All other tabulated data are at most another error interval lower.
Conclusion
The absorption coefficient of cadmium is determined in the region of the Cd K edge on two forms of the pure element, the vapor and the metal. In the vapor absorption spectrum, free of the structural signal, the fingerprints of collective excitations of the atom, real and virtual, can be observed. With a possible exception of coexcitations of the valence electrons, appearing within a few tens of eV above the edge in the XANES region of the structural signal and depending on the chemical state, the same pattern of the fingerprints is present in all chemical or physical forms of the element, so that the vapor spectrum can be regarded as the prototypical absorption of the element.
The comparison of metal and vapor absorption is also instrumental in the calibration of the energy scale of the data. The metal absorption edge energy is defined with high precision from the x-ray optics metrology; the continuum threshold energy of the free atom, on the other side, can be calculated from quantum-mechanical models. In the comparison experiment, the absolute accuracy of these estimates can be determined.
Acknowledgements
This work was supported by the IHP-Contract HPRI-CT-1999-00040/2001-00140 of the European Commission, the bilateral project BI-DE/03-04-004 by Internationales Buero des BMBF and the Slovenian Ministry of Education, Science and Sport. Provision of synchrotron radiation facilities by European Synchrotron Radiation Facility (proposal HE-1522) and Hasylab (project II-01-44) are acknowledged. We would like to thank Gloria Subias Peruga of ESRF beamline BM29 and Julia Wienold of HASYLAB station X1 for expert advice on beamline operation, and U. Kuetgens of PTB Braunschweig for original data from his precision K edge profile measurement on Cd foil.
Amusia, M.Y., Ivanov, V.K., Kupchenko, V.A., 1981. Photoionization of inner shells. J. Phys. B 14 (21), L667-L671.
Arp, U., Lagutin, B.M., Materlik, G., Petrov, I.D., Sonntag, B., Sukhorukov, V.L., 1993. K-absorption spectra of Ca, Cr, Mn and Cu. J. Phys. B 26 (23), 4381-4398.
Berger, M.J., Hubbell, J.H., Seltzer, S.M., Coursey, J. S., Zucker, D. S, 1999. XCOM: Photon Cross Sections Database, [Online] Available: http://physics.nist.gov/PhysRefData/Xcom/Text/XCOM.html [January, 2004].
Chantler, C.T., Olsen, K., Dragoset, R.A., Kishore, A.R., Kotochigova, S.A., Zucker, D.S., 2003. X-Ray Form Factor, Attenuation and Scattering Tables (version 2.0), [Online] Available: http://physics.nist.gov/PhysRefData/FFast/Text/cover.html [January, 2004].
Codling, K., Hamley, J.R., West, J.B., 1978. Absolute photoabsorption cross-section of atomic cadmium from 4d threshold to 250 eV. J. Phys. B 11 (10), 1713-1716.
de Jonge, M.D., Barnea, Z., Chanh, Q. T., Chantler, C.T., 2004. X-ray bandwidth: Determination by on-edge absorption and effect on various absorption experiments. Phys. Rev. A 69(2), art. no. 022717.
Deslattes, R.D., Kessler Jr., E.G., Indelicato, P., de Billy, L., Lindroth, E., Anton, J., et al., 2003. X-ray Transition Energies (version 1.0). National Institute of Standards and Technology, Gaithersburg, MD. [Online] Available: http://physics.nist.gov/XrayTrans [January, 2004].
Dyall, K.G., Grant, I.P., Johnson, C.T., Parpia, F.A., Plummer, E.P., 1989. GRASP – a general-purpose relativistic atomic-structure program. Comput. Phys. Commun. 55 (3), 425-456.
Filipponi, A., 2000. Deconvolution of the lifetime broadening from x-ray absorption spectra of atomic and molecular species. J. Phys. B 33 (15), 2835-2846.
Filipponi, A., Ottaviano, L., Tyson, T.A., 1993. Double-electron excitation channels at the L edges of atomic Hg. Phys. Rev. A 48 (3), 2098-2101.
Henke, B.L., Gullikson, E.M., Davis, J.C., 1993. X-ray interactions: photoabsorption, scattering, transmission, and reflection at E=50-30000 eV, Z=1-92, Atomic Data and Nuclear Data Tables 54 (2), 181-342. [Online] Available: http://cindy.lbl.gov/optical_constants/ [January, 2004].
Hubbell, J.H., 2003. Bibliography of Photon Total Cross Section (Attenuation Coefficient) Measurements, [Online] Available: http://physics.nist.gov/PhysRefData/photoncs/html/attencoef.html [January, 2004].Hubbell, J.H., Seltzer, S.M., 2001.Tables of X-Ray Mass Attenuation Coefficients and Mass Energy-Absorption Coefficients, [Online] Available: http://physics.nist.gov/PhysRefData/XrayMassCoef/cover.html [January, 2004].
Indelicato, P., Boucard, S., Lindroth, E., 1998. Relativistic and many-body effects in K, L, and M shell ionization energy for elements with 10 £ Z £ 100 and the determination of the 1s Lamb shift for heavy elements. Europ. Phys. J. D 3(1), 24-41.
Kodre, A., Arčon, I., Padežnik Gomilšek, J., Prešeren, R., Frahm, R., 2002. Multielectron excitations in x-ray absorption spectra of Rb and Kr. J. Phys. B 35 (16), 3497-3513.
Kodre, A., Arčon, I., Frahm, R., 1997. Exact atomic absorption background for Rb K-edge EXAFS. J. de Physique IV 7 (C2) 195-197.
Koningsberger, D.C., Prins, R., 1988. X-ray absorption spectroscopy (principles, applications, techniques of EXAFS, SEXAFS and XANES. John Wiley and Sons, NY.
Kraft, S., Stümpel, J., Becker, P., Kuetgens, U., 1996. High resolution x-ray absorption spectroscopy with absolute energy calibration for the determination of absorption edge energies. Rev. Sci. Instrum. 67 (3), 681-687.
Krause, M.O., Oliver, J.H., 1979. Natural widths of atomic K-levels and L-levels, K-alpha x-ray-lines and several KLL Auger lines. J. Phys. Chem. Ref. Data 8 (2), 329-338.
McMaster, W.H., Del Grande, N.K., Mallett, J.H., Hubbell, J.H., 1970. Compilation of X-Ray Cross Sections, Lawrence Livermore National Laboratory Report UCRL-50174, Sec. I. [Online] Available: http://www.csrri.iit.edu/periodic-table.html [January, 2004].
Mihelič, A., Kodre, A., Arčon, I., Padežnik Gomilšek, J., Borowski, M., 2002. A double cell for X-ray absorption spectrometry of atomic Zn. Nucl. Instrum. Methods Phys. Res. B 196 (1-2), 194-197.
Nageswara Rao, A.S., Perumallu, A., Krishna Rao, G., 1984. Photon cross-section measurements in compounds and elements in the energy-range 30-660 keV. Physica C 124 (1), 96-104.
Padežnik Gomilšek, J., Kodre, A., Arčon, I., Hribar, M., 2003. K-edge x-ray absorption spectra of Cs and Xe. Phys. Rev. A 68 (4), art. no. 042505.
Prema Chand, K., Reddy, D.K.S., Radha Krishna Murty, V., Rama Rao, J., Lakshminarayana, V., 1976. Photoelectric cross-sections of low-energy photons in light elements. J. Phys. B. 9 (2), 177-184.
Prešeren, R., Kodre, A., 1999. X-ray absorption coefficient of rubidium in the K-edge region. Radiat. Phys. Chem. 55 (4), 363-366.
Prešeren, R., Kodre, A., Arčon, I., Padežnik Gomilšek, J., Hribar, M., 1999. A simple heat-pipe cell for X-ray absorption spectrometry of potassium vapor. Nucl. Instrum. Methods Phys. Res. B 149 (1-2), 238-240.
Prešeren, R., Arčon, I., Mozetič, M., Kodre, A., Pregelj, A., 1996. X-ray absorption cell for alkaline metal vapors. Nucl. Instrum. Methods Phys. Res. B 111 (1-2), 161-162.
Stern, E.A., Newville, M., Ravel, B., Yacoby, Y.Y., Haskel, D., 1995. The UWXAFS analysis package – philosophy and details. Physica B 209 (1-4), 117-120.
Tajuddin, A.A., Chong, C.S., Shukri, A., Bandyopadhyay, T., Bradley, D.A., 1995. Measurement of mass attenuation coefficients of moderate-to-high atomic-number elements at low photon energies. Appl. Radiat. Isot. 46 (2), 113-115.
Teodorescu, C.M., Karnatak, R.C., Esteva, J.M., El Afif, A., Connerade, J.-P., 1993. Unresolvable Rydberg lines in x-ray-absorption spectra of free atoms. J. Phys. B 26 (22), 4019-4039.
Tulkki, J., Aberg, T., 1985. Near-threshod K-shell photoionization in argon. J. Phys. B 18 (15), L489-L495.
|
|
|||||||||||||||||||||||||||||||||||||||||||||||||||||||||||
|
E-mail:iztok.arcon@p-ng.si Last change: 28-Jun-2006 |
|||||||||||||||||||||||||||||||||||||||||||||||||||||||||||