Strong Bora winds in the Vipava valley
Since 2004 the Centre for Atmospheric Research (CRA) at the University of Nova Gorica has actively investigated a variety of atmospheric properties, including the Bora wind.
The Bora wind phenomenon is related to the coinciding presence of warm air in the lower regions of SW Slovenia and stable cold air-masses over central Slovenia, separated by orographic barriers. The cold air-masses subsequently flow over the barriers dividing the regions giving rise to strong, gusty winds. The development of Bora in the Vipava valley is a consequence of the particular terrain configuration of SW Slovenia. In less than 30 km, the terrain rises from Adriatic coast to the Carst plateu (300 m above sea level), and then falls into the Vipava valley (100 m a.s.l.) before rising again to Trnovski gozd range (up to 1500 m a.s.l.).
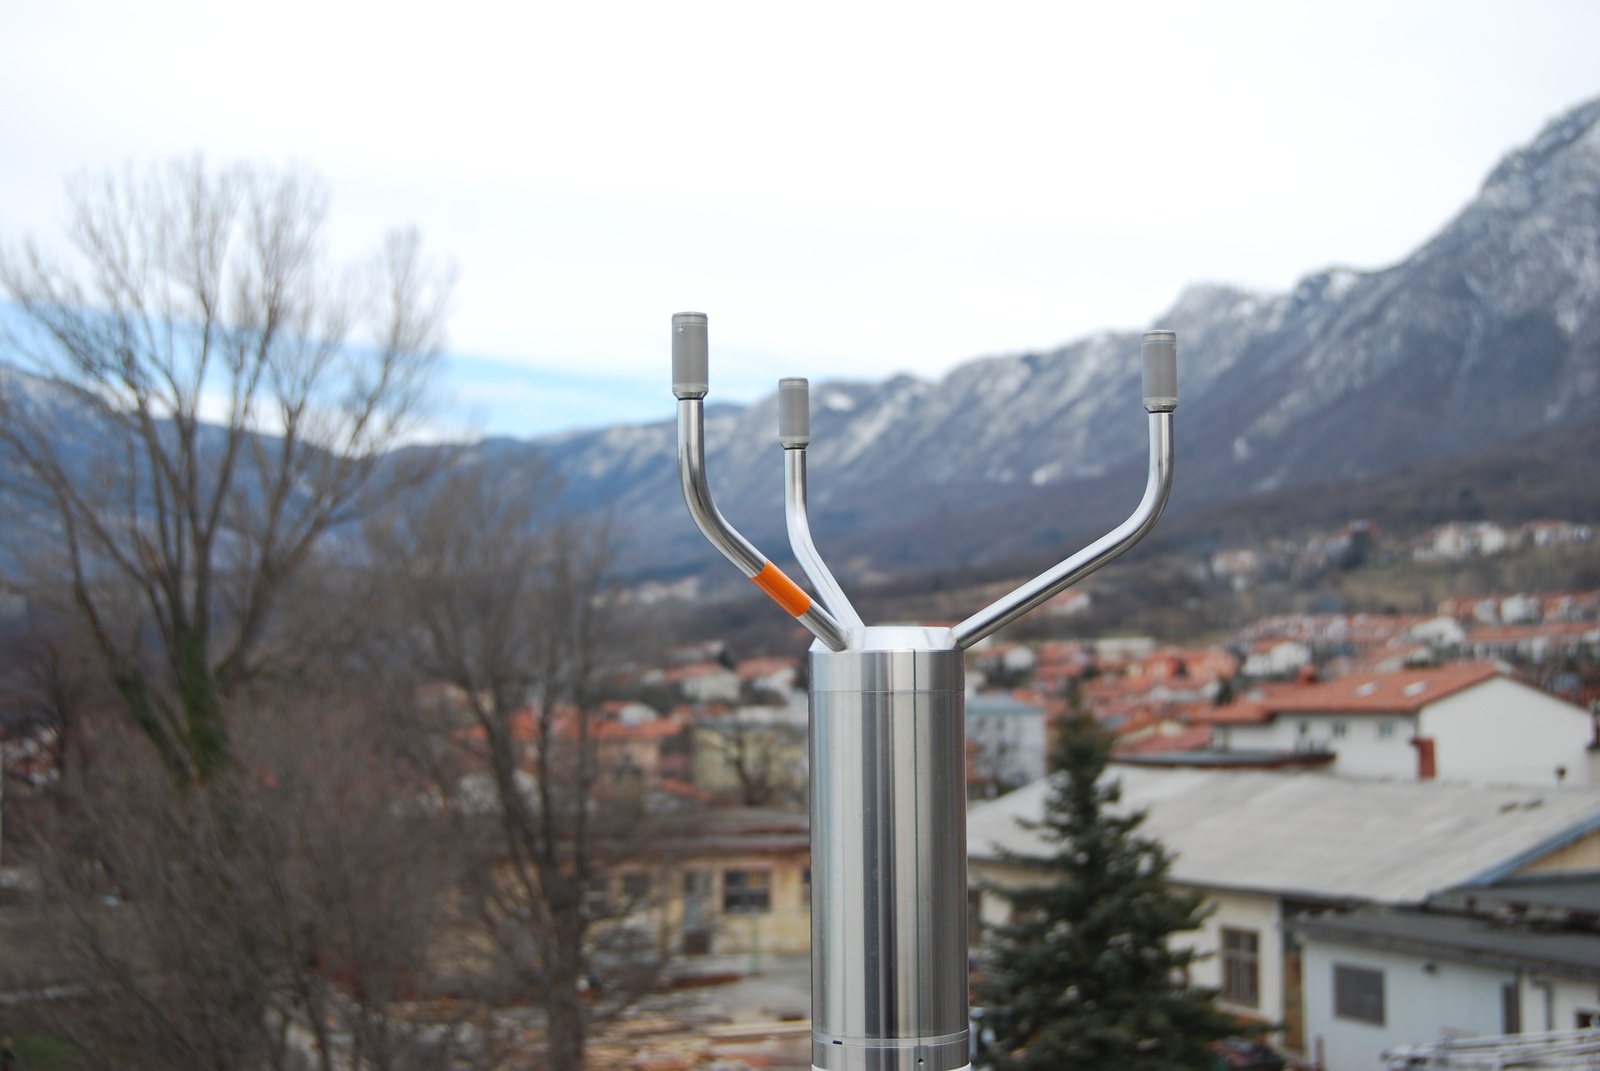
As traditional measurements of wind speed and direction have proven inadequate for a detailed analysis of the temporal variability of the Bora wind gusts, we are using high-speed 2D ultrasonic anemometers, which can sample wind speed and direction once per second. In collaboration with the Jožef Stefan Institute (IJS) and Slovenian Environment Agency (ARSO), we are monitoring wind properties with two such devices, one being located at the edge of the Trnovski gozd (at Otlica) and the other on the Vipava valley floor (in Ajdovščina). A detailed analysis of the acquired data will help us understand the origin and development mechanisms of the wind gusts, and provide information on the behaviour of air-flow streams during Bora wind events. Based on these measurements, we can develop more realistic descriptions of the streaming processes. These may, in turn, substantially improve meteorological models and consequently improve their predictive power regarding wind gust strength and periodicity/frequency in the Vipava valley. The research team investigating Bora winds includes the CRA centre head, professor Samo Stanič (UNG), professor Klemen Bergant (ARSO and UNG), professor Primož Škraba (IJS) and Maruška Mole, PhD student of physics at UNG.
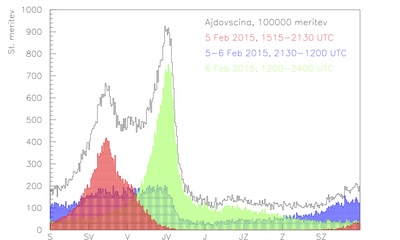
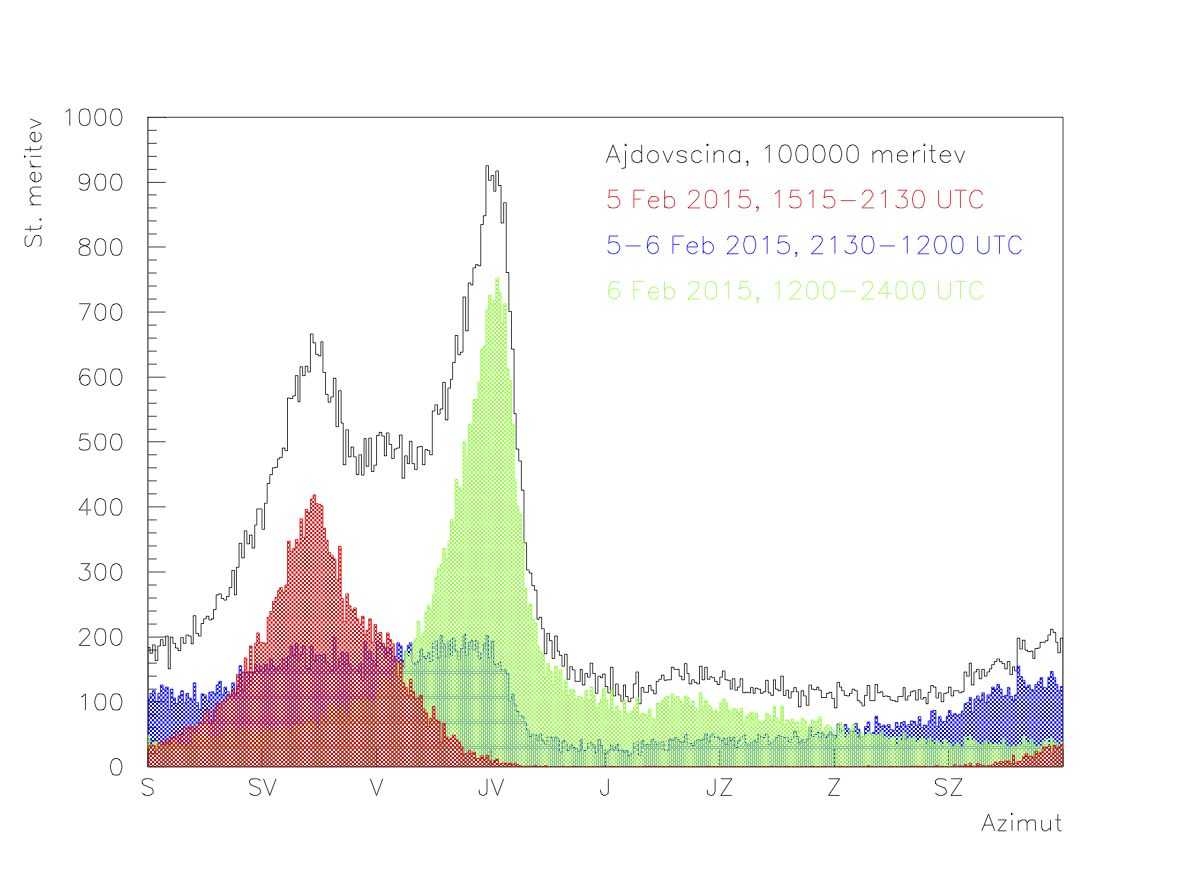
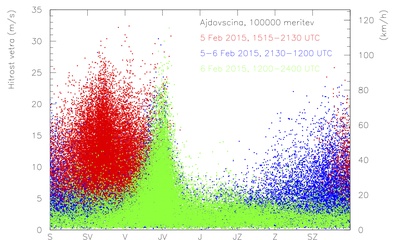
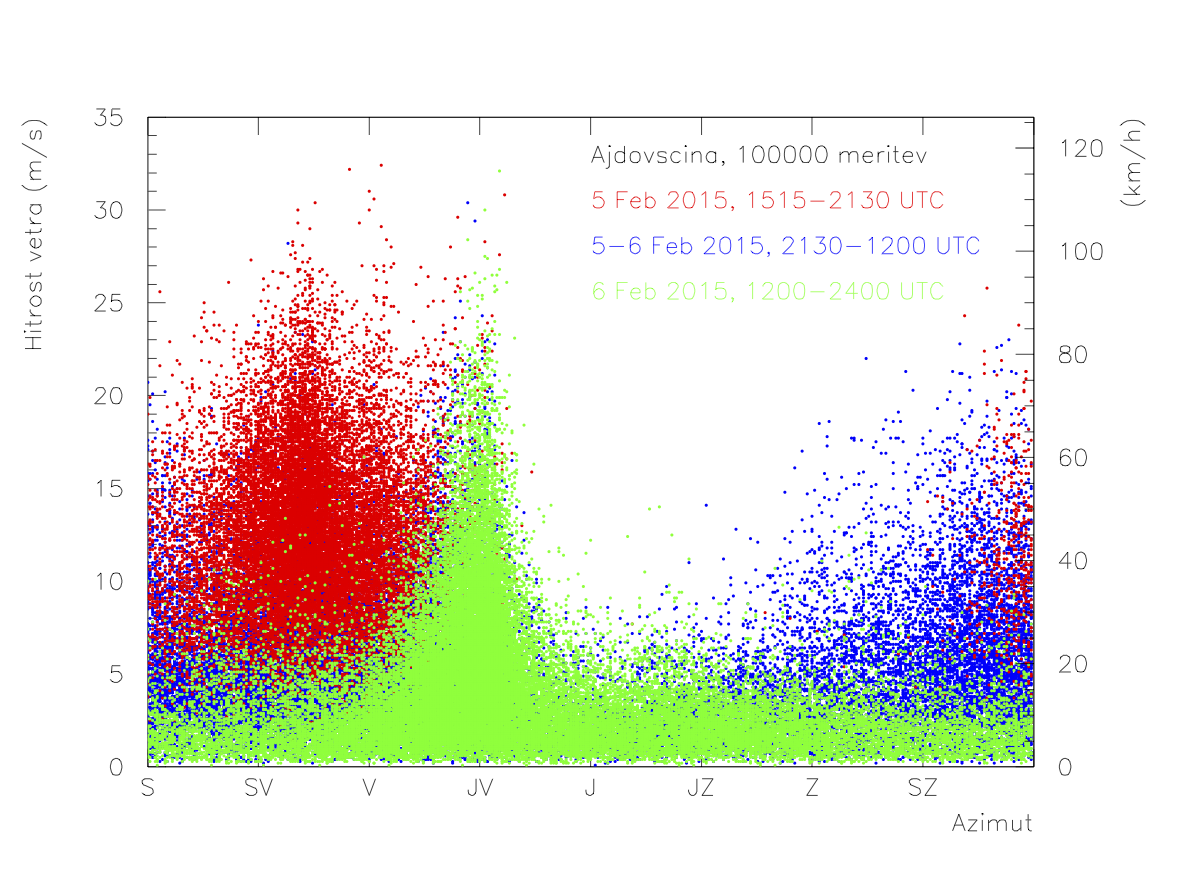
In the past week, we have witnessed a strong Bora wind event, lasting from Thursday, 5 February to Saturday, 7 February 2015. Preliminary analysis of the collected data indicates that the Bora was a result of air-masses streaming from predominantly two different directions. In the initial phase of the event (before late evening on 5 Feb.), the predominant wind direction was NE (streaming over the edge of the Trnovski gozd plateau). During the night, the direction gradually shifted to SE (streaming along the Vipava valley floor). The change was due to general meteorological conditions, in particular the development and route of the Mediterranean cyclone. The maximum gust speeds measured in Ajdovščina exceeded 33 m/s (about 120 km/h), which is considerably less than the speeds measured along the Vipava motorway. Lower wind speed values of the Ajdovščina measurements result from the location of the monitoring station in an urban area, while measurements along the motorway were performed in an open space, without obstructions to the air-flow. Our measurements however, provide information on the properties of the Bora wind to which the inhabitants of Ajdovščina were exposed.
Contact
Andreja Leban
Public Relations
T: +386 5 3315 397
E: andreja.leban@ung.si